
Visualize D-Bus activity
Bustle draws sequence diagrams of D-Bus activity, showing signal emissions, method calls and their corresponding returns, with timestamps for each individual event and the duration of each method call. This can help you check for unwanted D-Bus traffic, and pinpoint why your D-Bus-based application isn't performing as well as you like. It also provides statistics like signal frequencies and average method call times. ## Screenshots 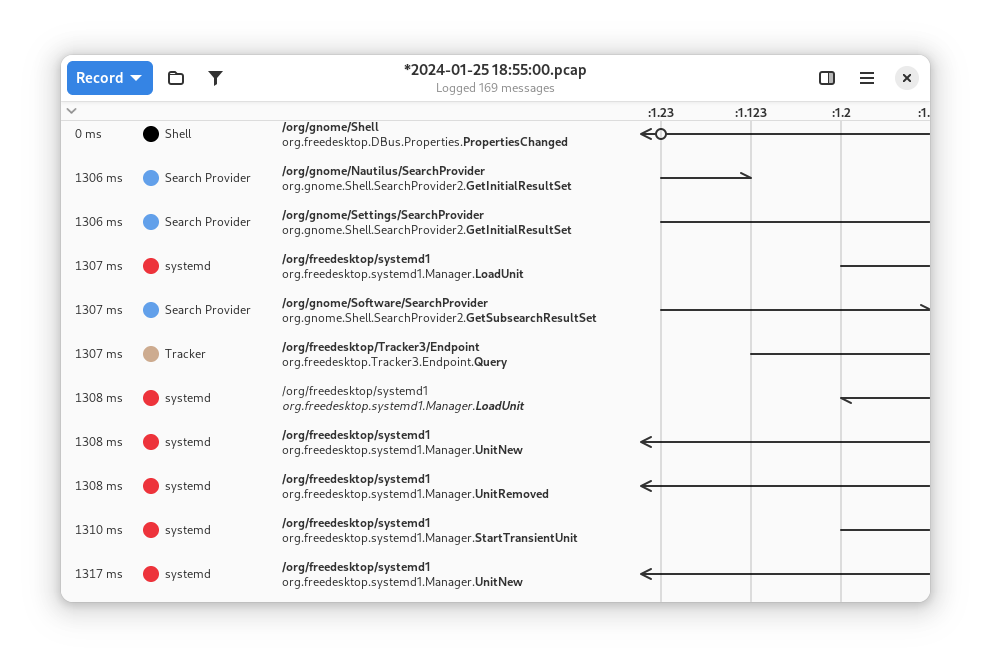 ## Hack on Bustle To build the development version of Bustle and hack on the code see the [general guide](https://welcome.gnome.org/en/app/Bustle/) for building GNOME apps with Flatpak and GNOME Builder. ## Translations Helping to translate Bustle or add support to a new language is very welcome. You can find everything you need at: [l10n.gnome.org/module/bustle/](https://l10n.gnome.org/module/bustle/) ## Code Of Conduct This project follows the [GNOME Code of Conduct](https://conduct.gnome.org/).